
View your most popular classes and their statistics
Compare attendance by schedule or class type, choose complete months or custom dates and interpret averages before changing the timetable.
Where: Popular Classes
Updated on
Open in MatGoatPopular Classes compares recorded activity by schedule or class type. It helps identify stronger average participation and highlights an individual session. Use the figures alongside class history: they depend on stored registrations rather than an independent measurement of people physically present in the room.
Choose a comparable period
Open Popular Classes in the teacher panel. The selector offers the current month, previous month, last three, six or twelve months, and a custom range. The current month ends today; the three-, six- and twelve-month options use complete months before the current one.
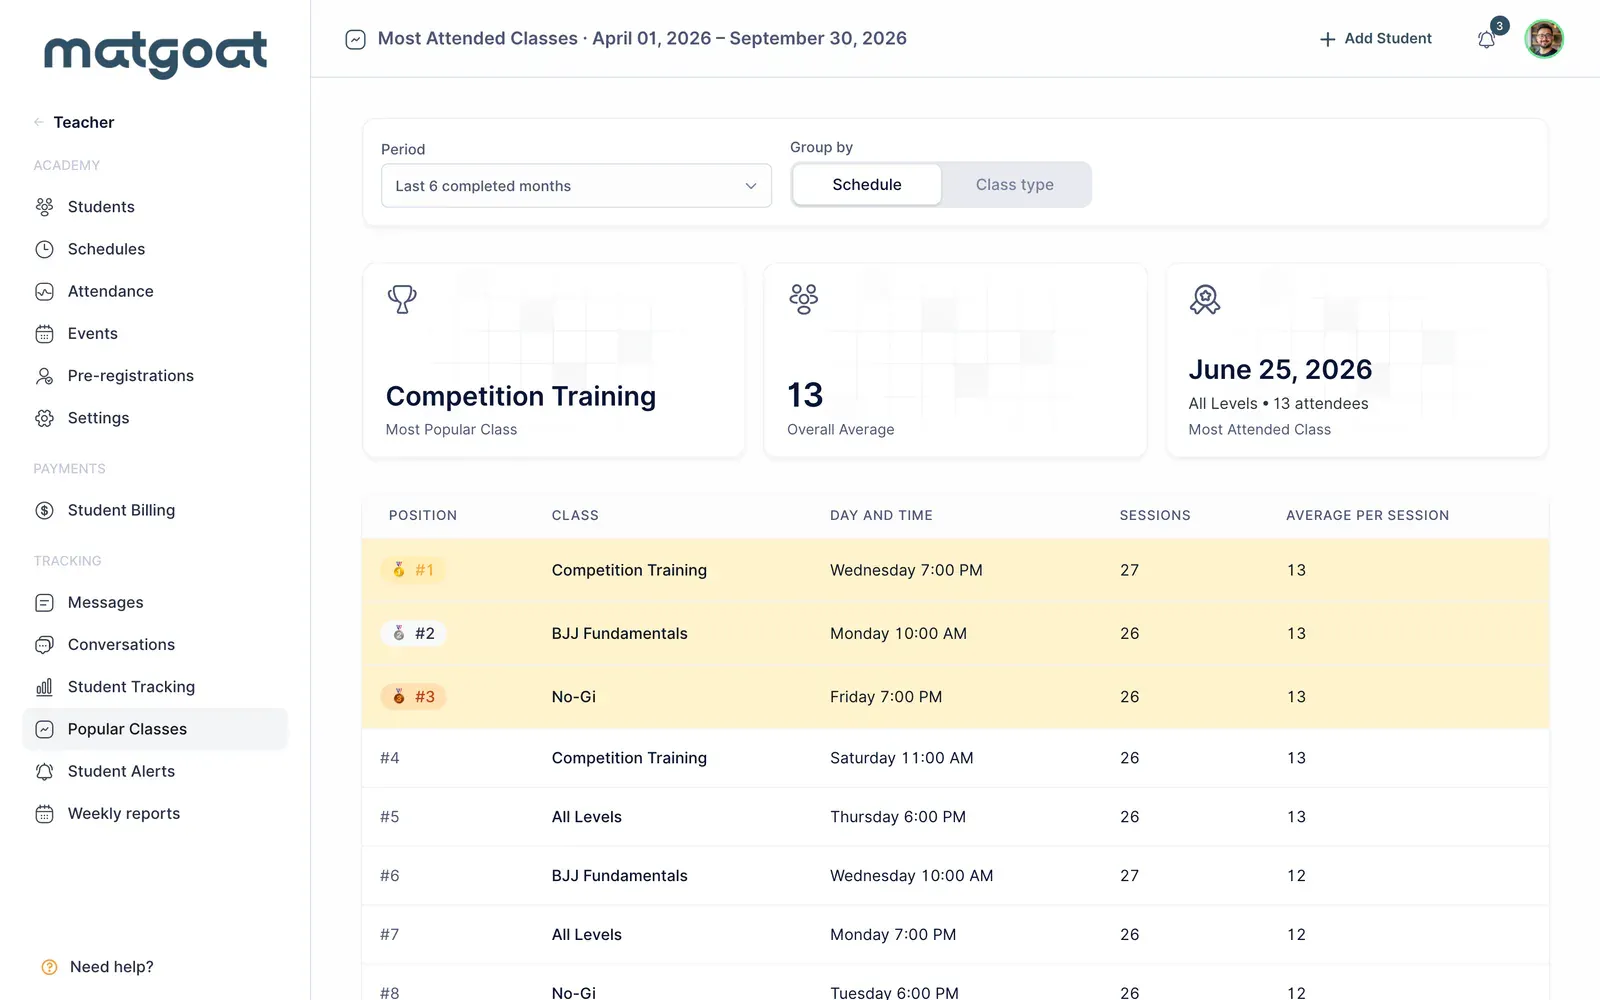
That difference matters when comparing figures. An unfinished month may contain only a few sessions, while a completed-month range includes all its days. Check the dates in the heading before concluding that an activity has grown or lost students.
Change the grouping
- Select the period you want to examine
- Choose Schedule or Class type under grouping
- For custom dates, set the start and end and apply the range
- Review averages alongside the number of sessions
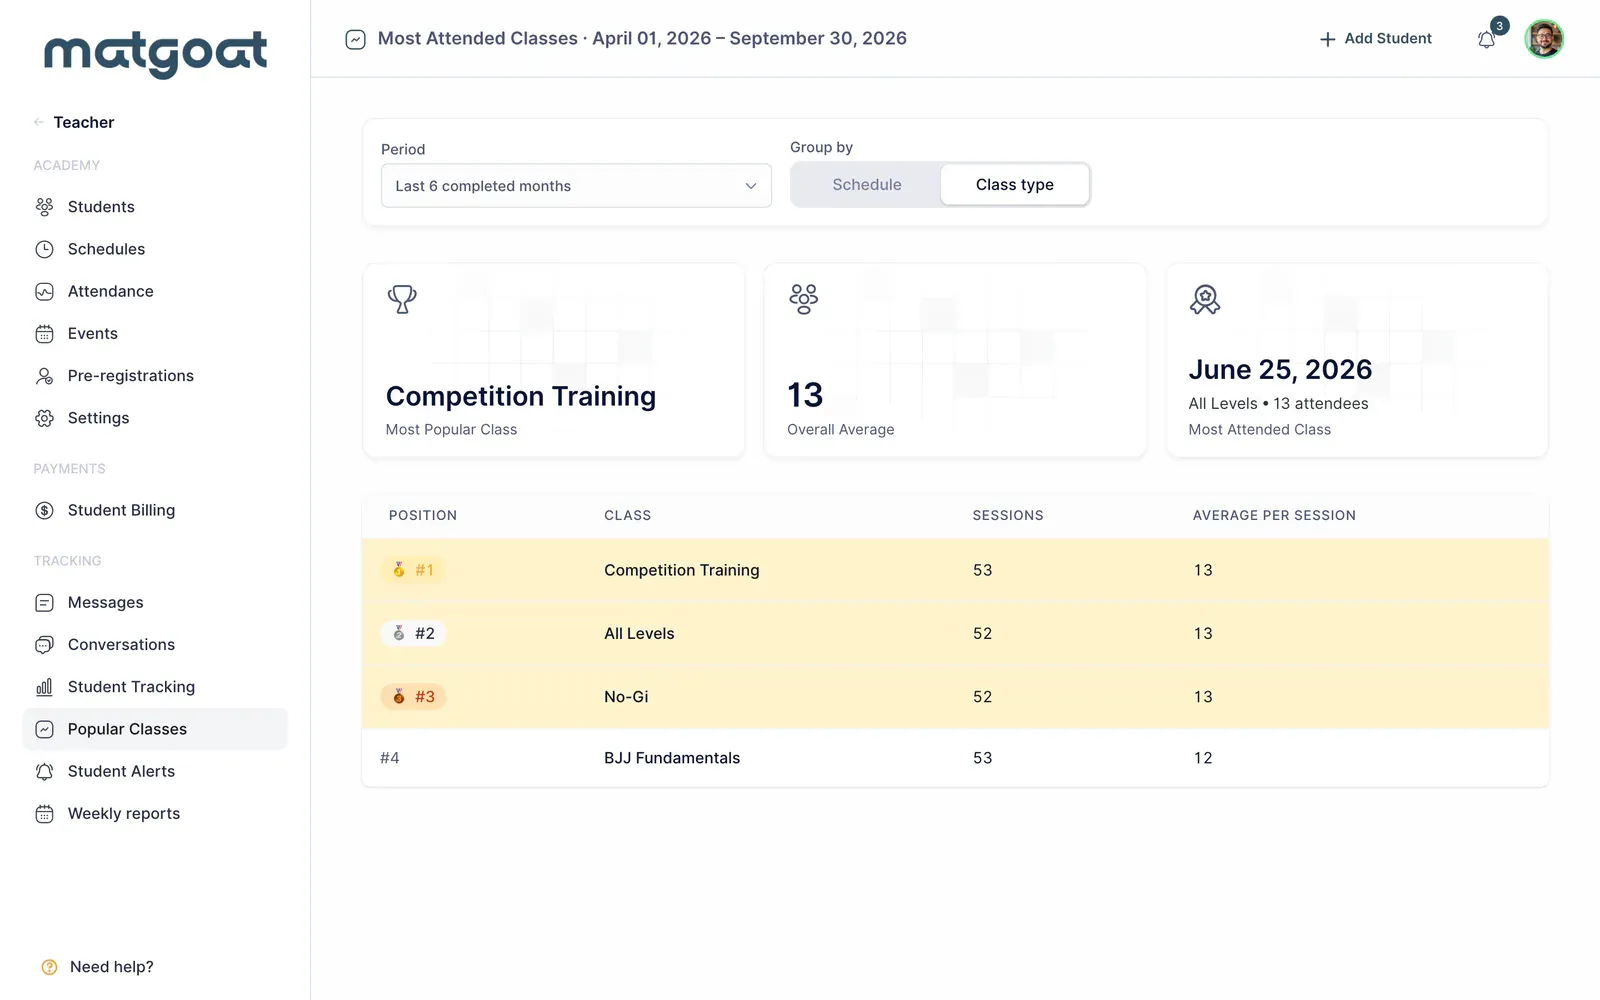
Schedule compares days and time slots; Class type combines sessions of an activity even when they run at different times. Switching grouping preserves the date range. There is no instructor filter here that automatically attributes the results to one teacher.
A custom range requires two valid dates in order and cannot end in the future. If an error appears, correct the range before interpreting an empty table as a lack of activity. The date controls describe the requested report interval, not a future scheduling operation.
Read averages and highlighted classes
The ranking uses average weighted registrations per session. A participant counts 1 and an observer 0.5. The summary also shows an overall average and a highlighted session with the highest recorded attendance. One exceptional session does not necessarily describe the schedule’s usual performance.
This screen aggregates registrations. If your academy uses preregistration, verify actual arrivals on the class sheet before treating the number as physically present people. Also review cancellations and sessions whose attendance lists were not completed accurately.
Turn the comparison into a decision
Compare equivalent periods and check how many sessions support each average. A newly created schedule with one class provides a different perspective from several weeks of records. Inspect the detail before moving an activity or reducing how often it runs.
To correct a registration, use the attendance sheet. To implement a schedule change after reviewing the data, consult weekly schedule setup and check its upcoming sessions.
Related articles
Still have questions?
Write to us and a real person will answer, in your language.